In a recent post Help me if you can, I’m feeling down….. , ManassasNatsFan asked this very interesting question:
One thing I wish I could find the stats for is our batting average against relievers and runs per inning. Compared to batting average against our relievers and how many runs per inning.
I could be wrong, but I am guess the difference is fairly big, and more likely our biggest reason we are way out.
We seem to score early fairly well but once the starters out our productivity dropped fast.
So I decided to see if I could use the gameday data that I’ve been loading to answer this question.
And the answer was yes, but complicated.
Before getting to MNFs question, today’s game, and indeed all three games against the Marlins, is perhaps a microcosm of the entire National’s season.
First a disclaimer:
- The gameday data is organized and optimized for the gameday applications on the web and browsers. It is not easy to do the kinds of aggregate that can be used to answer questions. As any geek knows, you have to restructure the data for that.
- Doing that is on a list for my free time when I need a Nats fix this winter.
- So the analysis below is influenced by the data I could easily get.
Which leads me to comment on this well known phrase:
There are lies, damned lies, and statistics
Which IMO is more about how too many people
- Want to simplify thing to just one number . . .
- . . . without providing the context or the assumptions behind the number(s)
- Carefully craft how the number(s) are presented to make their desired point.
With that background, let me describe what I did to research the question:
- I’ve presented the numbers from the offensive perspective instead of the pitchers perspective. In part because that is what I could more easily do with the data I currently can easily summarize.
- I’ve ignored the issue of earned vs unearned runs for the same reason. Factoring that in is on my list for later.
- Likewise, I charge runs to whoever is pitching when they were scored. Inheritted Runs are charged to the bullpen (which does bias the results to favor the starters and disfavor the bullpen). Again, factoring that in is on my list for later.
Note that in the tables below, the Avg column is the average number of runs per 9 innings – just like how ERA is calculated. Except, as noted above, runs and earned runs are combined and inherited runners who score are charged to the bullpen.
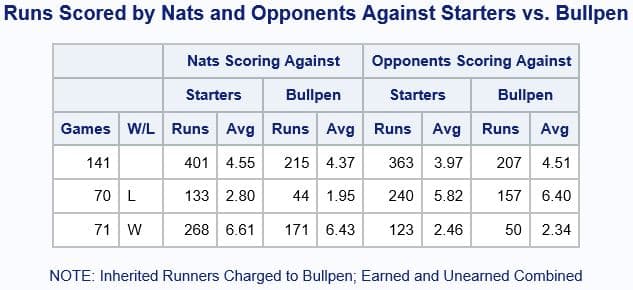
But wait a minute – the Nats offense ranks 8th in all of MLB in runs scored and 3rd in the NL (behind the Rockies and the Diamondbacks). This is actually a classic example of why totals and means can be so misleading. The Nats offense, if you look at the details, is boom or bust. And the same is true with the Bullpen.
So next lets take a look at what the results would be if neither bullpen gave up any runs (for completeness I still show the average runs for the bullpen). And there is a shocker there. 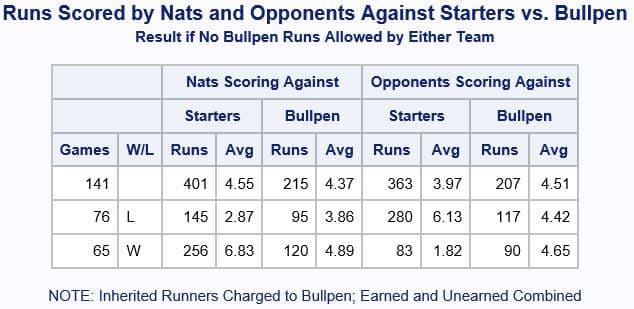
- maybe the issue is the starters
- or when the Nats score runs
- or . . . .
And the story gets even more complicated if you look at the splits by month. The table on the left is the complete game results; and the one on the right is assuming both bullpens are perfect.
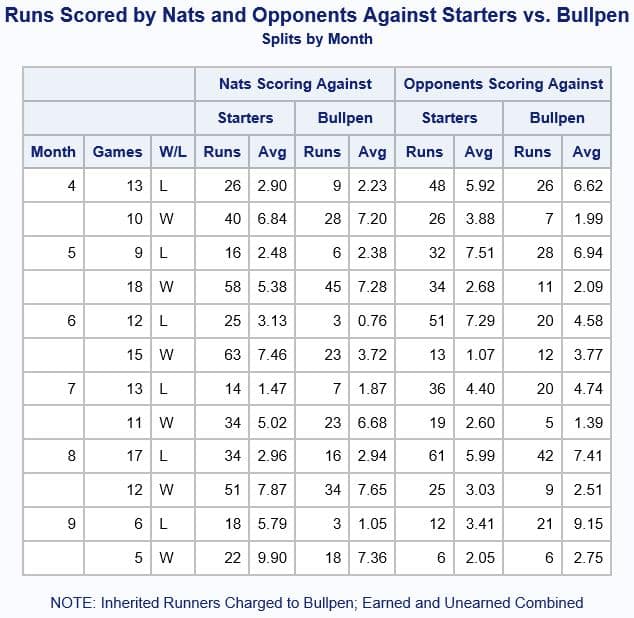
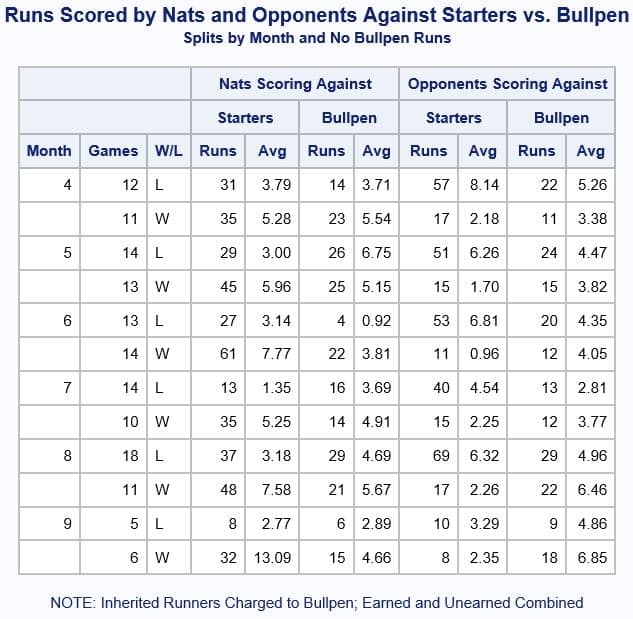
Lots to look at here.
But what jumps out at me is the difference between these two tables in May. In every other month, there is not that much difference between the two tables in terms of W-L. But in May something is going on. That is, of course, the only time this season where the Nats played like we expected. So the question is why. And there are lots of potential reasons.
Bottom line:
- You have to dig down into the details to figure things out. Looking at one or two numbers doesn’t cut it.
- There’s lots to analyze here.
- There are almost certainly multiple issues/problems.
Just some food for thought.

